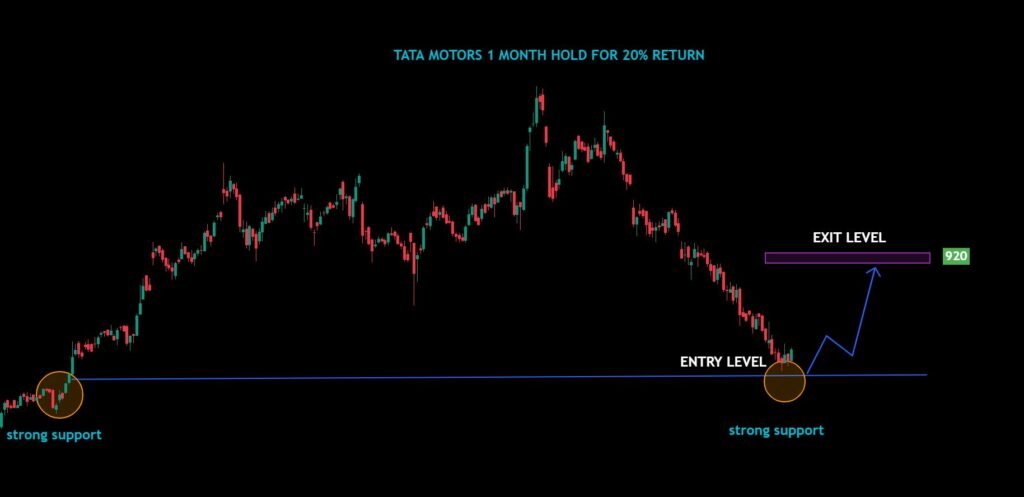
Analyzing the price chart of Tata Motors reveals a promising investment opportunity for traders looking to capitalize on a potential 20% return over a one-month holding period. Let’s break down the key levels and strategy outlined by the chart.

Support Zone
Support Level
This level has been tested multiple times, showing resilience and a high probability of reversal from this zone.
Entry Strategy
Traders can consider entering the stock when it bounces off this support level, ensuring they capture the uptrend from the beginning.
Target Zone
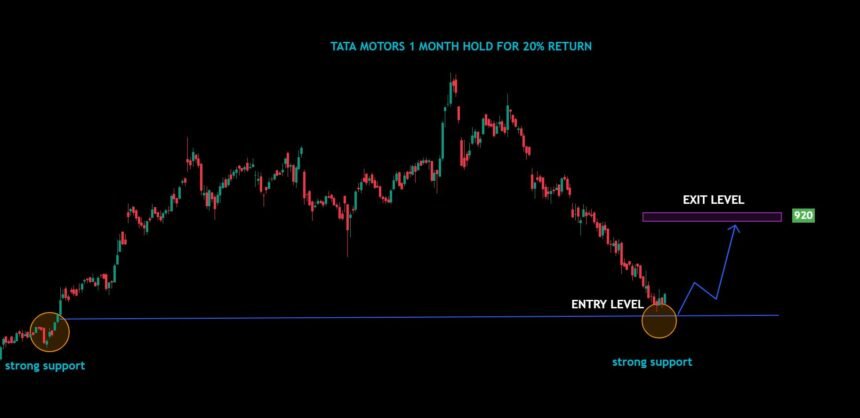
The projected exit level is around ₹920, marking a potential 20% upside from the current entry point. This target is based on previous price action and resistance levels identified in the chart.
Target Strategy
Exiting around ₹920 aligns with the anticipated short-term momentum, offering an attractive return within a month.
Risk And Reward
Risk
If the stock falls below the support zone, consider exiting to minimize losses.
Reward
A 20% return within a month positions this as a high-reward, short-term trade.
Conclusion
Tata Motors is presenting a strong technical setup for a quick 20% gain. By utilizing the support zone as a foundation and targeting ₹920 for an exit, traders can maximize their profit potential. Always complement technical analysis with broader market trends and company fundamentals to ensure informed decision-making.
Disclaimer
The information provided in this analysis is for educational and informational purposes only and should not be considered as financial advice. I am not a SEBI-registered advisor, and any investment decision made based on this content is at your own risk. Please consult with a certified financial advisor or do your own research before making any trading or investment decisions. Trading and investing in the stock market involve risks, and past performance is not indicative of future results.


