Silver Commodities Weekly Support and Resistance Levels
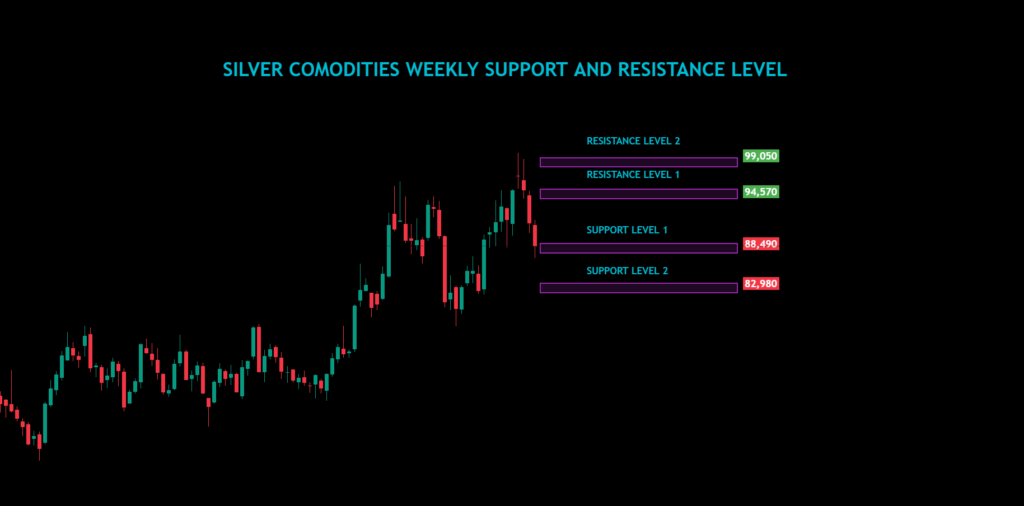
Resistance Level Of Gold Commodities
Resistance Level 1:
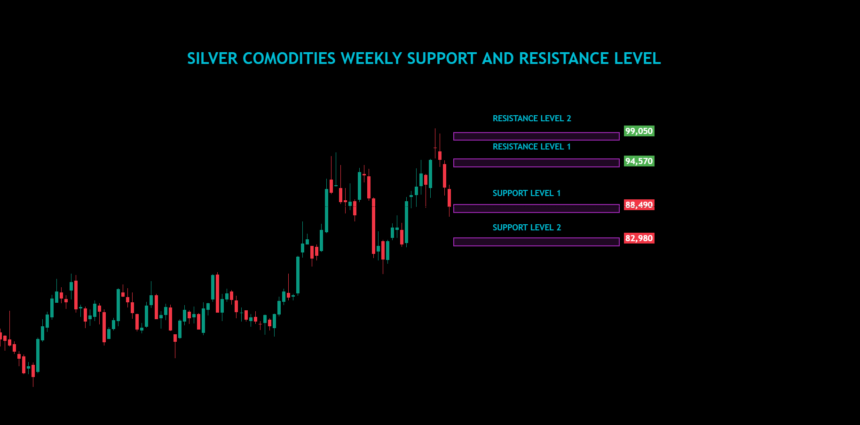
Silver Commodities 94,570 This level serves as the first resistance point. If gold’s price continues to rise, 94,570 would be the first line of defense for bears. Similar to the higher resistance level, 94,570 could either stop or slow down price momentum. Breaking this level would indicate that buyers are in control, pushing prices closer to the next resistance at 94,570.
For traders, this level is essential as it could mark the beginning of a reversal if prices cannot break through. Often, traders will place stop-loss orders slightly above this level to protect short positions if a breakout occurs.
Resistance Level 2:
Silver Commodities 99,050 The highest resistance level on this chart, 99,050 is a strong barrier. If gold’s price approaches this level, traders might anticipate selling pressure, which could cause a reversal or consolidation. However, a breakout above this level would signal bullish momentum, potentially leading to further gains.
Traders often place sell orders near this zone if they believe the price will reverse. However, if strong buying sentiment pushes gold above this level, it may suggest a breakout and a continuation of the bullish trend.
Support Level Of Gold Commodities
Support Level 1:
88,490 As the nearest support level, 88,490 plays a vital role in providing a buffer zone for gold prices. If prices decline to this level, buyers may step in, expecting a rebound. If the level holds, it can indicate the presence of strong demand, giving bullish traders confidence.
If the price breaks below 88,490 it may signal weakness, leading to further declines. Traders could use this level as a benchmark for entering long positions with stop-loss orders slightly below it, assuming the support holds.
Support Level 2:
82,980 This is the lowest support level, providing a solid base if gold experiences a strong sell-off. Reaching this point may attract significant buying interest, as lower prices often appeal to value-seeking investors. Holding above this level would suggest gold’s resilience and could lead to a potential bounce.
However, if the price dips below 82,980 it could trigger additional selling, as traders interpret this as a bearish signal. The breakdown of this support may lead to a deeper decline, impacting the commodity’s weekly performance.
Trading Strategies Based on Support and Resistance
For traders, these support and resistance levels offer critical insight into possible trade entries and exits. Here are some strategies that can be applied based on the chart’s data.
Range Trading:
If the price remains between the support and resistance levels, traders might consider buying at support levels and selling at resistance. This range-bound strategy allows traders to capitalize on minor fluctuations without expecting significant breakouts.
Breakout Trading:
When the price approaches a resistance level, traders look for a breakout that signals a continuation of the trend. A break above resistance (94,570 or 99,050) would indicate bullish momentum, while a drop below support (88,490 or 82,980) would signify bearish sentiment.
Stop-Loss Placement:
Traders often place stop-loss orders slightly beyond these levels to minimize risk. For instance, if going long near 75,950, setting a stop just below this support helps limit losses if the price falls.
Disclaimer
This article is for informational purposes only and does not constitute financial advice. Please consult a professional financial advisor before making any investment or trading decisions. We are not liable for any losses incurred from actions taken based on this information. Trading commodities involves risk, and past performance is not indicative of future results.


